Finance Module
Features
This module includes components for visualizing financial data. These components are based on the D3 library.
The module includes two components:
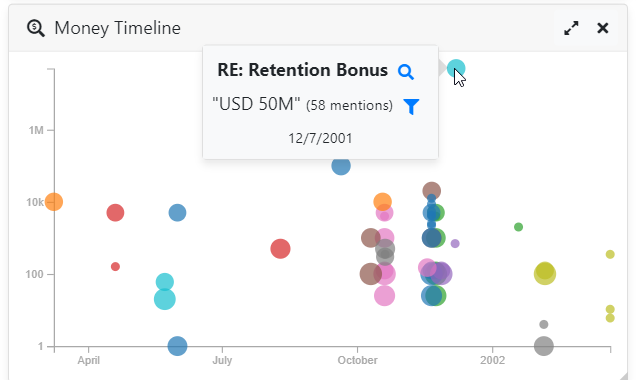
- A timeline component taking a list of records as an input and displaying amounts of money found in these records along a time axis.
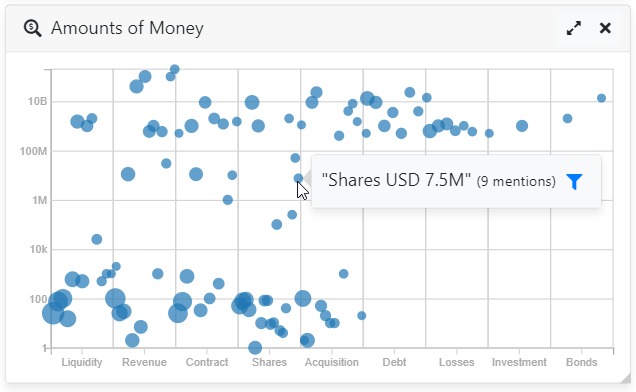
- A "cloud" component taking an aggregation as an input and displaying amounts of money associated to pre-defined categories.

Import
Import this module in your app.module.ts.
import { FinanceModule } from '@sinequa/analytics/finance';

@NgModule({
  imports: [
    ...
    FinanceModule
This module is internationalized: If not already the case, you need to import its messages for the language(s) of your application. For example, in your app's src/locales/en.ts:
...
import {enFinance} from "@sinequa/analytics/finance";

const messages = Utils.merge({}, ..., enFinance, appMessages);
Extracting amounts of money from indexed content
Some components in this module require "amounts of money" to be extracted from the content indexed by Sinequa. What we call an "amount of money" is for example the text in bold below:
The company grew its revenue by $1.32 billion this quarter.
Sinequa provides a built-in entity which extracts such amounts of money in English and French. What's more, it normalizes the entity so it can be used in components like these ones. For example, the above amount is normalized as USD 1320000000. To use this entity in your application, perform the following steps:
- Add the bult-in entity ("_amount", extracted in
entity4) to your NLP Analysis Parameters. - Index the content.
- In your App's query web service, configure an alias for
entity4(eg. "money"). - If required by the component, configure an aggregation for this column (eg. "Money").
Additionally, you might want to extract co-occurrence of amounts of money with another entity. Typically, you can have a simple "whitelist" entity (eg. "value") that extracts and normalizes a list of categories:
revenue
income
equity
assets
cash
salary;compensation
Then you can configure a cooccurrence entity (eg. "amount") that looks for combinations of the "value" and "money" entities, like in the sentence:
The company grew its revenue by $1.32 billion this quarter.
Such a cooccurrence entity would be extracted and normalized as (REVENUE)#(USD 1320000000). In the case of the "money-cloud" component, you will need to configure an alias and aggregation for this entity.
Money Timeline
The money timeline component (sq-money-timeline) displays amounts of money found in records (ie. search results, along a time axis). The component only requires a Results input. By default, the component assumes that amounts of money are extracted in a "money" column and that a "Money" aggregation is calculated against this column. The aggregation is used to size the "bubbles" representing each amount of money (the bigger the bubble means the amount of money is often mentioned in the results). The time axis corresponds to the "modifed" column of the records. The colors corresponds to different records in the results.

Main inputs:
results: TheResultsfrom which to extract the records and aggregation plotted on the timeline.moneyColumn(defaults:'money'): The column that stores the entity formatted asUSD 1234.moneyAggregation(defaults:'Money'): The aggregation computed over the above column.
When an amount is hovered with the mouse, and the user clicks on the "Inspect this document" button, the component emits an event recordClicked (which can be used by the parent to perform a custom action). The component automatically handles the action of filtering an amount of money (which adds a filter to the search query, of the type money: USD 1234).
Money Cloud
The money cloud component (sq-money-cloud) displays amounts of money found in the results sorted by categories. The component only requires a Results input. By default, the component assumes that cooccurrence of amounts of money and categories are extracted in a "value_amount" column and that a "ValueAmounts" aggregation is calculated against this column. Only the aggregation is used to plot the data (no records are used, unlike the timeline component). The bigger the bubble means the cooccurrence is often mentioned in the results. The colors correspond to the currencies found in the amount of money.

Main inputs:
results: TheResultsfrom which to extract the aggregation plotted on the timeline.moneyValueColumn(defaults:'value_amount'): The column that stores the entity formatted as(REVENUE)#(USD 1320000000).moneyAggregation(defaults:'ValueAmounts'): The aggregation computed over the above column.
The component automatically handles the action of filtering a cooccurrence (which adds a filter to the search query, of the type value_amount: (REVENUE)#(USD 1320000000)).