Debugging your SBA
SBA run in the browser, on the client side. When you develop your app, you will frequently have runtime errors, which typically result in the app freezing or not responding as expected. It is very useful to know how to use your browser's "Inspector" to find out what is going wrong.
Modern browsers all have an inspector tool that you can open with F12, or right-clicking on your app and selecting "Inspect". Inspectors are typically divided in tabs, each providing various features, such as:
- Console: Displays errors and log messages from your app. Also lets you execute JavaScript commands (if you stopped the app with a breakpoint, the commands are executed in the current breakpoint's scope).
- Elements: Displays the HTML of the webpage, and let's you inspect specific elements of the DOM (Document Object Model). You can also see and edit the styles applied to any element (which is useful for styling your app without rebuilding your app between each iteration).
- Sources: Displays the source code of the app, which includes normally Javascript and CSS, but in the case of an Angular app compiled in debug mode (the default with
ng serve), you also have access to the Typescript and SCSS sources. - Network: Displays all the HTTP requests emitted by your app, which lets you see the details of the interactions with the Sinequa API (requests to and responses from the server), as well as all other downloaded resources.
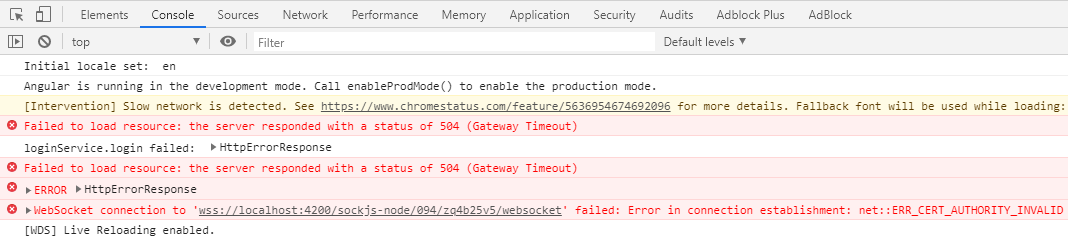 The console displayed in the Chrome inspector
How to deal with runtime errors
-
Read the error message. The messages are not always clear and explicit but don't ignore them. After a while, you will recognize these errors and the solutions will become obvious with experience.
-
Look in the error message for names of parameters and components from your app, or from the Sinequa libraries. If you recognize a name it's likely a good place to start investigating in your code.
-
Google the error message. It's unlikely you are the only person having that problem. Google is likely to give you a lot of ideas on how to deal with the problem. However, some errors are too generic and don't put you in the right direction.
-
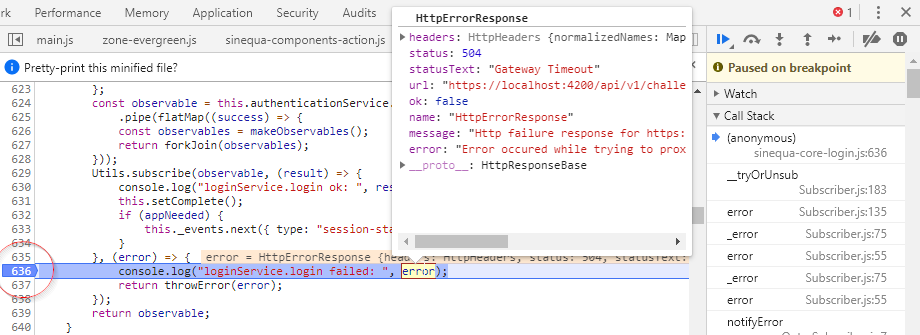
Look at the linked source, if any. An error message often has a source file and line number linked on the right:
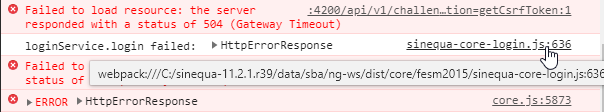
If the source file is one of yours, it probably contains the error. If it is an Angular file, it probably means you misused an Angular feature at some point.
-
You can also open a specific source file of your app (or from the Sinequa libraries) by exploring the tree in the Source tab.
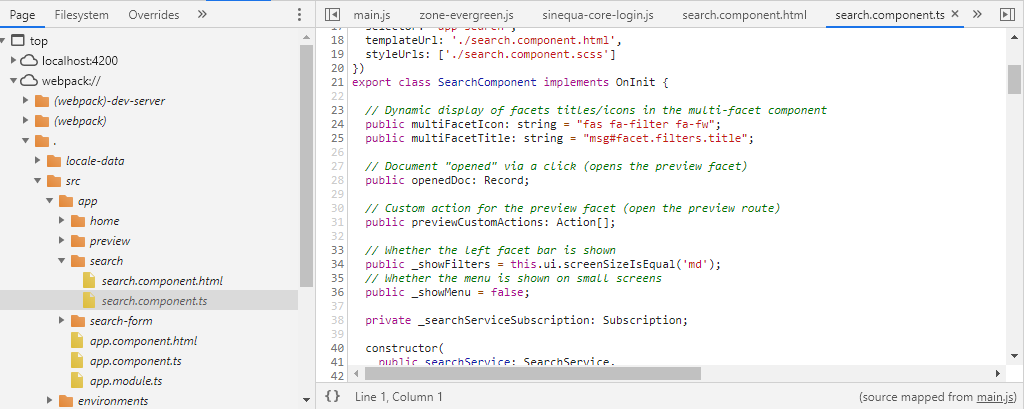
The sources of your app are normally under webpack:// > . > src, and the (compiled) sources of the Sinequa libraries under webpack:// > C:\... > dist > components/fesm2015
-
In the source, add a breakpoint before the point where the app failed and refresh your app to reach that breakpoint.
-
When your app reached the breakpoint and paused, there are many things that you can try, such as:
- Looking for the values of variables in the scope, simply by hovering your mouse over these variables in the source code.
- Run JavaScript commands in the Console (you have access to the scope of the breakpoint).
- Keep executing the app step by step (buttons on the right).
-
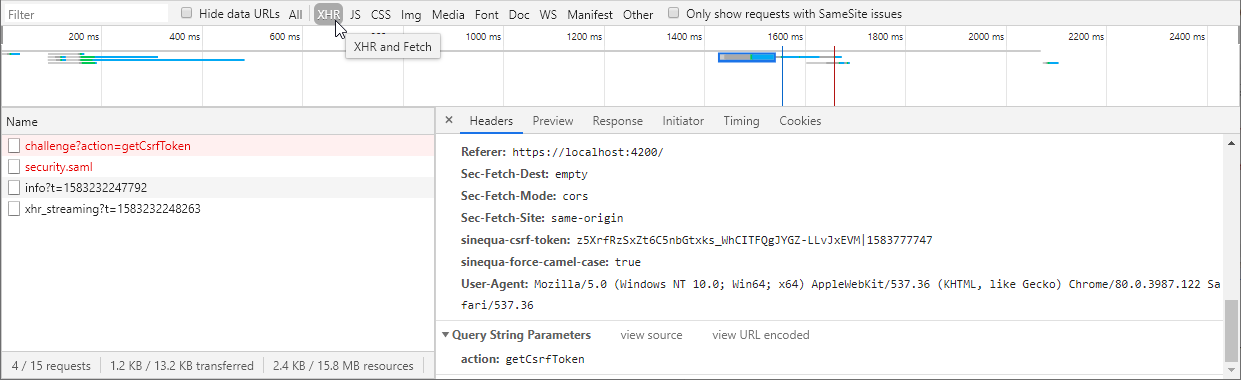
Look for failures in the Network tab. Failures are indicated in red. You often want to filter for XHR requests, which correspond to the interactions with the API (all the static resources are hidden). Both the requests and responses may contain interesting information.
-
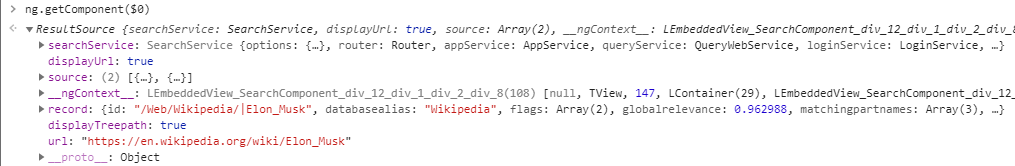
Inspect the state of your Angular component. You can easily select an Angular component by clicking on it in the Elements tab (and/or by use the selection tool).
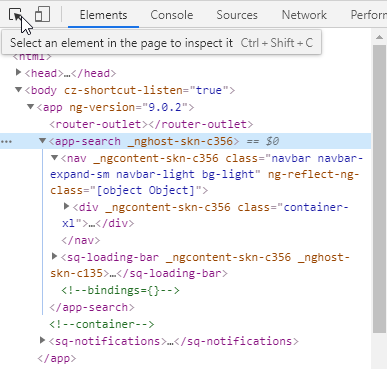
In the example above, the Angular component are easy to spot: they are the ones with non-standard HTML names (like
<div>,<span>, etc.), and generally have a prefix (<sq-...>for Sinequa components,<app-...>for the components of your app).When an element is selected, you can access it with
$0in the console. If the selected element is an Angular component, you can get the instance of this component by typingng.getComponent($0), which gives you access to all its fields and properties.